









Healthcare cost per lead typically falls within a broad range depending on specialty, channel, and how tightly you define a qualified lead, though some high-value categories run higher. The number itself tells you almost nothing on its own. What matters is whether that cost is sustainable once you weigh it against what a new patient is actually worth and how many leads convert into booked appointments. Before judging any CPL figure, pause and check whether your tracking even counts the right things.
TL;DR:
- Count genuine inquiries, exclude spam and wrong number calls, and include agency, landing page, tracking, and CRM costs; a $40 CPL can become $55 to $60.
- Therapy CPLs often run $20 to $60, dental $30 to $90, and specialty clinics $50 to $150; compare only when channels and lead definitions match.
- Calculate a ceiling from lead to patient conversion and gross profit per patient, then reserve margin for overhead and cap lead volume at scheduling capacity.
- Set 60 to 90 second call thresholds, import booked and attended appointments, and reconcile platform conversions with CRM records monthly to track actual patient outcomes.
- Before adding pixels or call tracking, assess whether tools can access protected health information; vendors handling it may require a signed business associate agreement.
Table of Contents
- 1. The real CPL formula and the common ways practices miscalculate it
- 2. Benchmarks: realistic CPL ranges for healthcare subcategories and how to interpret them
- 3. How to set a practice-specific CPL target (work backward from economics)
- 4. Measurement essentials for healthcare: tracking calls, importing outcomes, and valid quality rules
- 5. Privacy and HIPAA considerations when you track leads
- 6. How to lower CPL without destroying lead quality: tactical sequence
- 7. Putting it together: a 90-day measurement and test plan
- 8. Impact of seasonality and market competition on healthcare CPL fluctuations
- 9. Case studies or examples demonstrating CPL improvements in specific healthcare niches
- 10. How patient demographics and geographic targeting influence healthcare CPL
- 11. Role of lead qualification criteria and lead nurturing strategies in effective CPL management
- 12. Using advanced analytics and attribution models to better understand CPL drivers and ROI
- 13. Publisher perspective: how we approach CPL for healthcare clients
- 14. How we can help reduce your healthcare CPL
- FAQ
- Sources
1. The real CPL formula and the common ways practices miscalculate it
The formula is simple on paper: total marketing cost divided by qualified leads equals your real cost per lead. The complexity hides in both halves of that equation.
A “qualified lead” is not every click, form fill, or ringing phone. It is a contact with real intent, meaning they are inquiring about a service you offer, in your service area, with a legitimate reason to book. Counting spam form submissions or wrong-number calls as leads flatters your CPL and buries the truth about what patient acquisition actually costs you.
Total marketing cost also needs to include more than ad spend. We routinely see practices leave out:
- Management or agency fees tied to the campaign
- Landing page hosting, design, and maintenance costs
- Call forwarding and tracking software fees
- CRM or scheduling software costs tied to lead handling
Once you fold those in, a campaign that looked like it was generating $40 leads often sits closer to $55 or $60 once the full cost structure is counted.
The mistakes compound from there. Many practices count every phone call as a lead regardless of duration, which means a 12-second hang-up gets treated the same as a 10-minute consultation booking. Others compare conversion windows inconsistently, pulling last week’s spend against leads that converted over 30 days, which skews the ratio in either direction depending on campaign momentum. A third common error is ignoring offline conversions entirely: a patient who called, didn’t book immediately, then scheduled two weeks later through a follow-up call never gets attributed back to the campaign that generated them.
None of this is about chasing precision for its own sake. It’s about making sure the number you’re using to make budget decisions reflects reality rather than a platform’s optimistic default settings.
2. Benchmarks: realistic CPL ranges for healthcare subcategories and how to interpret them
Healthcare lead costs vary more by subcategory than almost any other industry we work in, and treating a single blended average as a target is one of the fastest ways to misjudge performance.
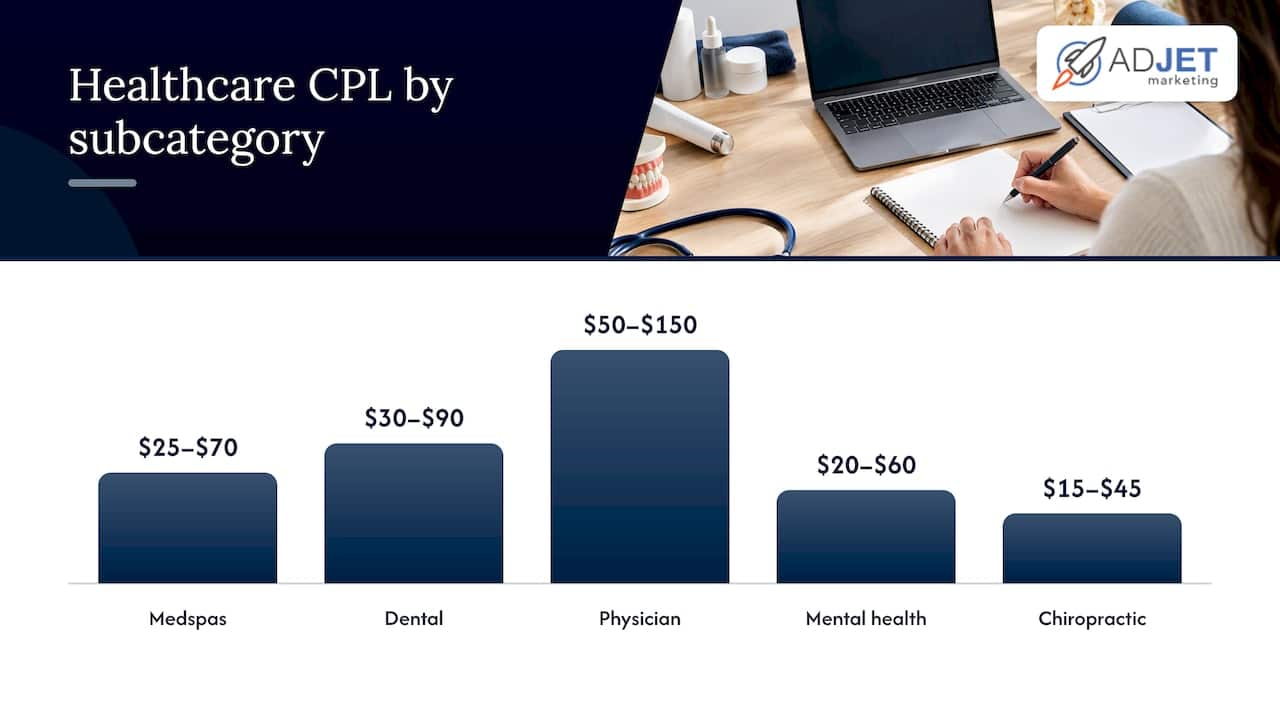
Medspas and aesthetic practices often see CPLs in the $25 to $70 range for consultation leads, though injectable and body-contouring campaigns can run higher given the competition. Dental practices tracking new-patient leads typically fall between $30 and $90, with cosmetic and implant campaigns at the upper end. Physician practices and specialty clinics vary widely, often $50 to $150, depending on how niche the service is. Mental health and therapy practices tend to run lower, frequently $20 to $60, reflecting both softer competition in many markets and shorter, lower-cost conversion paths. Chiropractic leads often land in the $15 to $45 band. Imaging centers and diagnostic services, where the buying decision usually comes from a referring physician rather than direct consumer search, see different dynamics entirely and are harder to benchmark against consumer-facing categories. Weight-loss and medical weight-management campaigns, fueled by heavy demand for GLP-1 related services, have pushed costs up substantially in many markets over the past two years.
Google Ads benchmarks differ by channel, date, and definition, and should always be checked against the date they were measured before you treat them as current WordStream’s 2026 Google Ads benchmarks guide notes that averages shift year to year and that healthcare subcategories show wide spreads depending on service line and intent.
What actually drives the variance within any one category:
- Channel: search intent traffic costs more per lead than social or display but usually converts at a higher rate.
- Offer strength: a free consultation offer pulls more volume at a lower CPL than a paid diagnostic service.
- Geography: competitive metro markets push CPL up regardless of specialty.
- Conversion definition: counting all form fills versus only phone calls over 60 seconds changes the number dramatically for the same campaign.
If you want to compare your CPL against any benchmark fairly, you need to match the channel, the time period, and the conversion definition first. A $45 CPL measured as “all calls” is not comparable to a $45 CPL measured as “calls over 90 seconds that led to a booked consult.” They are different metrics wearing the same label.
3. How to set a practice-specific CPL target (work backward from economics)
Industry benchmarks are a starting reference, not a target. The only CPL number that matters for your practice is one built from your own economics, and the calculation is more straightforward than most practice owners expect.
- Calculate your average gross profit per new patient, factoring in the first visit and, where relevant, typical repeat visits or lifetime value over a defined period.
- Estimate your lead-to-appointment conversion rate: of 100 leads, how many actually book a visit.
- Estimate your appointment-to-patient conversion rate: of those booked, how many show up and become paying patients.
- Multiply those two conversion rates together to get your overall lead-to-patient rate.
- Multiply that rate by your gross profit per patient to find your theoretical maximum CPL, then apply a margin of safety, since you also need room for overhead, ad management, and reinvestment in growth.
WordStream’s benchmark guide frames this directly: set CPL targets by working backward from patient value and conversion rates rather than copying an industry average, since no universal profitable CPL exists across payer mix, margin, and geography.
Here’s a worked example using illustrative numbers, not market data:
In this example, a $112 CPL is the breakeven ceiling, and a $67 target leaves room for overhead and reinvestment. A practice with thinner margins per visit or a lower show rate needs a correspondingly lower CPL ceiling, which is exactly why copying someone else’s benchmark without doing this math first leads practices to either overspend or walk away from campaigns that were actually profitable.
One adjustment many practices skip: your capacity to actually serve new leads. If you can only onboard 20 new patients a month regardless of demand, driving CPL down further than your scheduling capacity allows just creates a backlog, not more revenue.
4. Measurement essentials for healthcare: tracking calls, importing outcomes, and valid quality rules
CPL is only as trustworthy as the measurement behind it, and healthcare practices lean heavily on phone calls as a conversion type, which makes call tracking the foundation of accurate numbers.
Dynamic forwarding numbers, set up through Google’s call tracking tools, let you attribute incoming calls back to the specific campaign, ad group, or keyword that generated them, rather than lumping every phone inquiry into a single undifferentiated bucket.
From there, quality rules matter as much as the tracking itself:
- Set a minimum call duration, often 60 to 90 seconds, before a call counts as a qualified lead rather than a hang-up or wrong number.
- Use call recording and review where appropriate to confirm calls are genuine inquiries, not vendor calls or spam.
- Import booked and attended appointment outcomes back into your ad platform so the algorithm optimizes toward patients, not just raw contacts.
Google Ads documentation confirms that call recordings can be analyzed and phone call conversions imported, which lets campaigns optimize for calls that actually produce appointments rather than calls alone. This is a meaningful shift from the default setup most practices start with, where every call counts equally regardless of outcome.
Operationally, this means your CRM needs a few non-negotiable fields: lead source, call duration, booked status, and appointment date, each timestamped. Without that data trail, reconciling ad platform numbers against what actually happened in your schedule becomes guesswork.
Pro Tip: Reconcile your ad platform’s reported conversions against your CRM’s booked appointments monthly.
This measurement layer takes real setup time, typically two to four weeks to get fully wired, but it is the difference between optimizing toward vanity numbers and optimizing toward patients who show up.
5. Privacy and HIPAA considerations when you track leads
Tracking leads in healthcare carries compliance weight that other industries don’t have to think about, and skipping this step is one of the more consequential corners practices cut when chasing lower CPL.
HHS guidance on online tracking technologies makes clear that covered entities must evaluate tracking tools for PHI exposure, and that vendors creating, receiving, maintaining, or transmitting protected health information may qualify as business associates requiring a signed BAA. That applies to pixels, analytics scripts, and call tracking tools alike, not just obvious cases like patient portals.
The practical distinction that matters most: unauthenticated pages, like your homepage or a general service page, carry lower PHI risk and can typically use standard analytics. Authenticated pages, like a patient portal or appointment confirmation page where someone’s identity and health context are both present, carry meaningfully higher risk and often require stricter controls or no third-party tracking at all.
Before enabling any new tracking or vendor integration, a short checklist helps:
- Audit every pixel, script, and form on your site for what data it captures and where it sends it.
- Confirm which vendors require a business associate agreement based on what they can access.
- Minimize tracking scope on any page where identity and health information combine.
- Loop in your compliance lead or legal counsel before launching, not after.
- Document every BAA you have in place and review them annually.
This isn’t about avoiding tracking altogether. It’s about designing measurement that respects data minimization from the start, which in our experience actually makes campaigns easier to defend and maintain over time.
6. How to lower CPL without destroying lead quality: tactical sequence
Lowering CPL is easy if you don’t care about lead quality. The harder, more useful problem is lowering it while keeping or improving the percentage of leads that actually become patients. We tend to work through optimizations in a specific order, because fixing the wrong thing first often hides the real problem.
- Audit and tighten your conversion definitions first. If your “leads” include unqualified form spam or sub-10-second calls, no amount of campaign optimization fixes a measurement problem.
- Segment campaigns by service line and intent. A practice running one blended campaign for both general checkups and a high-value cosmetic procedure is almost always overspending on the wrong clicks for one of the two.
- Improve landing pages and calls to action to lift conversion rate, which lowers effective CPL without touching bids at all. A page that converts at 8% instead of 4% effectively halves your cost per lead on the same spend.
- Target high-intent search placements and build out negative keyword lists aggressively to cut spend on low-intent browsing traffic.
- Train front desk staff to maximize appointment booking from inbound calls and forms, since even a well-targeted, well-converted lead is wasted if it isn’t followed up on quickly or handled well on the phone.
Pro Tip: Response speed matters more than most practices assume. A lead contacted within five minutes books at meaningfully higher rates than one contacted an hour later, so front desk process is often a bigger lever than ad spend.
The order matters because campaign-level changes only pay off once your definitions and landing experience are solid. We’ve seen practices chase bid adjustments for weeks trying to fix a problem that was actually a broken landing page losing half its traffic before the form ever loaded.
7. Putting it together: a 90-day measurement and test plan
A structured 90-day window gives you enough time to fix measurement, run meaningful tests, and make a real scale-or-hold decision, without dragging the process out indefinitely.
- Weeks 0 to 2: Audit your current conversion definitions and compliance posture. Set up dynamic call forwarding numbers and confirm tracking fires correctly across every campaign and landing page.
- Weeks 3 to 8: Run structured A/B tests on landing page layout, headlines, and ad creative. Begin importing booked and attended appointment outcomes back into your ad platform so bidding starts optimizing toward real patients.
- Weeks 9 to 12: Shift bidding strategy to optimize directly toward imported appointment outcomes rather than raw clicks or calls. Review results against your target CPL band and decide whether to scale budget, hold steady, or pause underperforming segments.
| Phase | Primary metric | Decision cutoff |
|---|---|---|
| Weeks 0-2 | Tracking accuracy (CRM vs. platform match) | Gap under 15% before proceeding |
| Weeks 3-8 | Landing page conversion rate | Meaningful lift vs. baseline before scaling spend |
| Weeks 9-12 | CPL against target band, booking rate | Scale if within target band and ROI positive |
By week 12, you should have a real answer, not a guess, about whether your current channel mix and setup can hit your target CPL band sustainably. If it can’t, that’s valuable information too: it may point you toward reallocating budget toward organic search or a different channel mix rather than continuing to push paid spend against a ceiling your economics can’t support.
8. Impact of seasonality and market competition on healthcare CPL fluctuations
Healthcare CPL is not static throughout the year, and treating a single month’s number as representative is a common source of frustration for practice owners watching costs shift.
Elective and cosmetic categories, including medspa and weight-loss services, often see CPL rise in January and early spring as resolution-driven demand increases competition for the same keywords. Dental and general wellness categories can see modest seasonal dips around major holidays, when fewer people are actively searching for non-urgent care, followed by a rebound in January as insurance deductibles reset. Mental health search volume tends to hold steadier year-round, though awareness campaigns and seasonal affective patterns can shift demand slightly in fall and winter months.
Market competition compounds seasonality. When a new practice enters a metro area and starts bidding on the same core keywords, CPL across that whole category can rise even if your own campaign hasn’t changed. This is particularly visible in weight-loss and aesthetic categories right now, where demand driven by GLP-1 medications has pulled new competitors into paid search aggressively over the past two years.
The practical takeaway is to benchmark your own CPL against your own historical trend, month over month and year over year, rather than assuming a flat number should hold steady indefinitely. A CPL increase in January for a medspa isn’t necessarily a sign something is broken. It may simply reflect a market-wide seasonal pattern that affects every competitor bidding in the same auction.
9. Case studies or examples demonstrating CPL improvements in specific healthcare niches
Pattern recognition across healthcare niches tends to matter more than any single case, since the specific levers that move CPL differ by specialty even when the underlying principle, better measurement leads to better decisions, stays the same.
In pain management clinics, we’ve seen the most common issue be undercounting: practices treating every call as equal when a meaningful share were insurance verification calls or referral coordination rather than new patient inquiries. Once call-duration and content-based qualification rules were added, the reported CPL often rose on paper, simply because fewer calls counted, but the cost per genuinely qualified lead frequently dropped because budget stopped being wasted chasing volume on low-value traffic.
In medspa marketing, landing page specificity tends to move the needle more than bid strategy. A single generic landing page covering every service usually converts worse than dedicated pages built around specific treatments, since a visitor searching for a particular procedure lands on content that speaks directly to that intent rather than a general practice overview.
For dental practices, the recurring pattern is campaign segmentation: separating general checkup campaigns from higher-value cosmetic or implant campaigns, so budget isn’t shared unevenly between a $150 cleaning and a $4,000 procedure under one blended target.
None of these patterns are guarantees for any specific practice, since local competition, service mix, and starting measurement maturity all shape the outcome. The consistent thread is that CPL improvements usually come from fixing definitions and segmentation before they come from bidding harder or spending more.
10. How patient demographics and geographic targeting influence healthcare CPL
Who you’re trying to reach and where they live both shape CPL in ways that are easy to underestimate when setting a budget.
Geographic targeting is often the bigger lever of the two. Dense, competitive metro markets, where multiple practices bid on the same core service keywords within a few miles of each other, almost always carry a higher CPL than suburban or rural markets with less competition for the same search terms. A practice in a major metro area targeting a broad radius will typically pay more per lead than one with a tightly defined service area, simply because the auction dynamics differ.
Demographic targeting affects CPL less directly but still meaningfully, mainly through how it shapes ad relevance and conversion rate. A campaign targeting an age range or income bracket that closely matches your actual patient base tends to convert better, which lowers effective CPL even if the raw cost per click stays flat. Broadening targeting too far in an effort to increase volume often brings in clicks from people outside your real service area or outside the demographic most likely to book, which raises CPL by diluting lead quality rather than by increasing competition.
Practices sometimes respond to high CPL by widening their geographic radius to capture more volume, which can backfire if the added leads come from areas too far to realistically drive to for an appointment. Narrowing geographic targeting to a realistic drive-time radius, even if it reduces total lead volume, often improves both CPL and the percentage of leads that actually book, since every lead generated is genuinely reachable.
11. Role of lead qualification criteria and lead nurturing strategies in effective CPL management
A low CPL on unqualified leads is worse than a higher CPL on leads that actually convert, which is why qualification criteria deserve as much attention as the campaigns generating the leads in the first place.
Qualification criteria should be specific and documented, not left to judgment call by whoever answers the phone. Useful criteria typically include service area match, insurance or payment method fit where relevant, and a clear statement of need rather than a vague inquiry. Codifying this into a simple checklist for front desk or intake staff keeps qualification consistent across different team members and shifts.
Nurturing matters just as much once a lead is qualified but hasn’t booked yet. Many healthcare leads, particularly for elective or higher-cost procedures, don’t convert on the first contact. A structured follow-up sequence, combining a prompt phone call attempt, a follow-up text or email, and a second call attempt within 48 hours, recovers a meaningful share of leads that would otherwise be marked as lost after a single missed call.
The connection to CPL is direct: a practice that qualifies loosely and nurtures inconsistently will see a worse ratio of spend to actual patients than a practice with the exact same ad performance but tighter intake and follow-up discipline. This is one of the areas where marketing performance and front-office operations overlap completely, and where improvements often cost little beyond process discipline rather than additional ad spend.
12. Using advanced analytics and attribution models to better understand CPL drivers and ROI
Basic last-click attribution, where the most recent ad click or search gets full credit for a conversion, is the default in most ad platforms and the easiest to set up, but it tends to oversimplify how healthcare patients actually make decisions.
Many patients research a practice across multiple sessions and sometimes multiple channels before booking: an initial search ad click, a return visit via organic search a few days later, then a direct visit to book after reading reviews. Last-click attribution credits only the final touchpoint, which can make earlier-funnel channels like SEO or content look artificially weak even when they played a real role in building trust before conversion.
Data-driven or multi-touch attribution models, available in most major ad platforms, distribute credit across multiple touchpoints based on their actual contribution to conversion, giving a more accurate picture of which channels deserve credit and budget. For practices running both paid and organic efforts simultaneously, this distinction matters: a channel mix that looks inefficient under last-click attribution can look considerably more balanced once earlier-funnel contributions are accounted for.
Beyond attribution models, cohort-based analysis, tracking a group of leads from a specific month or campaign through their full lifecycle to booked and retained patient status, gives a clearer long-term ROI picture than any single-month CPL snapshot can. This is particularly useful for practices with recurring revenue models, like med spas or chiropractic care, where the first visit’s value understates a patient’s full lifetime contribution. Pairing CPL with these deeper analytics transforms it from a standalone number into part of a fuller picture of marketing return.
13. Publisher perspective: how we approach CPL for healthcare clients
Our sequence rarely changes: audit measurement first, instrument tracking properly, optimize based on real outcomes, then scale what works. Skipping straight to optimization on broken measurement just means optimizing toward the wrong signal faster.
Realistically, CPL takes three to six months to stabilize into a trustworthy, repeatable number, and we tell clients that upfront rather than promising faster results. Many clinics come to us after poor lead quality from a previous setup, usually because calls and forms were being counted without any quality filter.
A pattern we see often: a practice reports a $35 CPL that looks great until call-duration rules and booked-outcome imports reveal the real qualified-lead cost closer to $70, which is still often profitable once matched against actual patient value, just not the number the platform was showing by default.
— Felix
14. How we can help reduce your healthcare CPL
If your current CPL feels high, or worse, feels untrustworthy, the fix usually starts with measurement rather than budget. We work with medical clinics, med spas, dental practices, and specialty providers to build the tracking and campaign structure that makes CPL a number you can actually act on.
Services that typically matter most here:
- Google Ads management built around call tracking, conversion imports, and healthcare-specific campaign segmentation
- Conversion-focused landing page design to lift conversion rate without raising spend
- HIPAA-aware tracking setup that keeps pixel and analytics use within compliance boundaries
- SEO work to build a lower-cost, longer-term lead channel alongside paid search
An audit engagement typically starts with a review of your current tracking setup, conversion definitions, and recent campaign data, followed by a clear breakdown of where your real CPL stands versus what your platform is reporting. From there, we outline specific fixes before any budget changes happen.
If you want a clearer picture of what your leads actually cost and whether your current setup is measuring it accurately, our Google Ads services page is the right place to start.
This article is general information, not a substitute for advice from a qualified doctor. Consult a qualified healthcare professional about your own circumstances before acting on anything here.
FAQ
What is CPL, cost per lead, in marketing terms?
Cost per lead, or CPL, is total marketing spend divided by the number of qualified leads generated in that period. The key detail is the word qualified: a lead should meet a clear definition, such as a genuine inquiry with real intent, not every click or form submission regardless of quality.
What is a typical lead conversion rate by industry?
Conversion rates vary significantly by industry, channel, and how a conversion is defined, so there is no single figure that applies everywhere.
How do I calculate my practice’s marketing cost accurately?
Add together ad spend, management or agency fees, landing page and software costs, and call tracking fees for the period you’re measuring, then divide by your count of qualified leads. Leaving out fees or software costs understates your real CPL and can lead to budget decisions based on an incomplete number.
What counts as a reasonable customer acquisition cost in healthcare?
A reasonable acquisition cost depends entirely on your margin per patient and your lead-to-patient conversion rate, which is why working backward from your own economics matters more than copying an industry figure. WordStream’s benchmark guidance recommends setting your ceiling based on patient value and conversion rates rather than a flat industry average, since profitable CPL varies by payer mix, margin, and geography.
How can I tell if my tracking setup is measuring CPL correctly?
Compare your ad platform’s reported conversions against your CRM’s actual booked and attended appointments for the same period each month.
Sources
- WordStream benchmarks (2026) — Google Ads benchmarks guide
- Set up tracking calls to a phone number on a website – Google Ads Help
- HIPAA guidance on online tracking technologies – HHS