









Track patient acquisition cost, cost per booked appointment, patient lifetime value, lead-to-appointment and appointment-to-patient conversion rates, and show rate. Those five numbers tie marketing spend directly to booked and kept visits, which is the only outcome that pays your bills. Everything else, including impressions, clicks, and raw lead counts, is a supporting signal at best.
TL;DR:
- Tracking only ad spend for patient acquisition cost often underestimates true marketing expenses and risks overinvesting in unprofitable channels.
- Conflating cost per lead with cost per booked appointment can hide the effectiveness of campaigns and lead to misallocated budgets.
- A healthy patient lifetime value typically exceeds three times the acquisition cost, with a common target ratio around 3:1 to ensure sustainability.
- Monitoring show rate and appointment-to-patient conversion rates reveals whether issues lie in scheduling, reminders, or the patient experience.
- Implementing integrated tracking with UTMs, call tracking, intake-source fields, and practice management data is essential for accurate KPI calculation and marketing decision-making.
Table of Contents
- Healthcare Marketing KPIs: Definitions and Formulas That Matter
- How to Measure Healthcare Marketing KPIs Without Guessing
- Building a Weekly, Monthly, and Quarterly KPI Dashboard
- Healthcare Marketing Benchmarks and Realistic Targets
- Common KPI Measurement Mistakes and a 90-Day Fix
- How to Segment KPIs by Specialty and Service Line
- Where Patient Satisfaction and NPS Fit Into Marketing Measurement
- Digital Presence KPIs: Traffic, Bounce Rate, and Search Rankings
- Social Media Metrics That Actually Matter for Healthcare
- Benchmarking Against Competitor Performance
- The Real Reason KPI Discipline Wins Budget Conversations
- Getting Your KPI Tracking Instrumented Correctly
- Sources
- FAQ
Healthcare Marketing KPIs: Definitions and Formulas That Matter
Most clinics track too many numbers and the wrong ones. You don’t need thirty metrics on a dashboard. You need a handful that actually change what you do with your budget, and you need to calculate them correctly.
Patient acquisition cost (PAC) is your total marketing spend divided by the number of new patients acquired in a given period. The formula looks simple, but the mistake we see constantly is under-counting spend. PAC should include media spend, agency or staff time, landing page and creative production, and any software or call-tracking tools you’re paying for. If you only count ad spend, your PAC looks artificially low and you’ll overinvest in a channel that isn’t actually profitable.
Cost per booked appointment is a different number than cost per lead, and conflating the two is one of the most common errors in healthcare marketing. Cost per lead just tells you how much you paid for a name and phone number. Cost per booked appointment divides spend by the number of appointments actually scheduled on your calendar. A campaign can generate leads cheaply and still be a poor investment if few of those leads ever book.
Patient lifetime value (PLV) estimates the total revenue a patient generates over their relationship with your practice, not just their first visit. A simple version: average visit value multiplied by average number of visits per year, multiplied by average patient retention in years. The PAC to PLV ratio is where the real insight lives. A widely used working target is a PLV-to-PAC ratio considered healthy when the patient’s lifetime value is several times what it costs to acquire them.
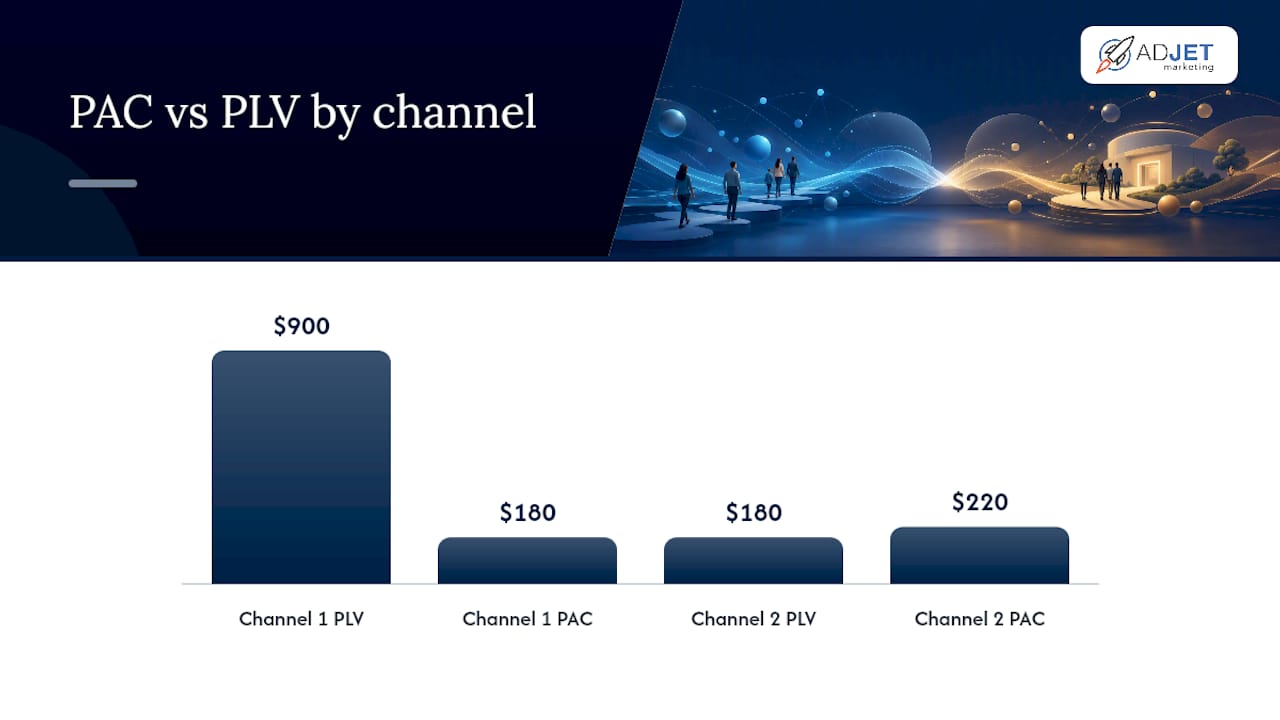
Here’s a worked example. Say your PAC is $180 and your average patient generates $150 per visit, comes back three times a year, and stays with your practice for two years. That’s $900 in lifetime value against $180 in acquisition cost, a 5:1 ratio. Healthy. Now say a different channel produces patients at $220 PAC who only average 1.2 visits total before churning. That’s roughly $180 in lifetime value against $220 in cost, a ratio under 1:1. Same clinic, two channels, wildly different verdicts.
Lead-to-appointment and appointment-to-patient conversion rates tell you where your funnel is leaking. If lead-to-appointment is strong but appointment-to-patient (your show rate) is weak, the problem isn’t your marketing. It’s your scheduling process, your reminder cadence, or your intake experience.
Show rate deserves its own line item because it quietly wrecks ROI calculations that ignore it. Essential healthcare marketing KPIs always include show rate alongside PAC and PLV, precisely because a booked appointment that never happens generates zero revenue while still counting as a “conversion” in most ad platforms.
Channel-level conversion rate and early return on marketing investment (ROMI) signals round out the picture. Track conversion rate by channel (paid search, paid social, organic, referral) separately, because blending them hides which channel is actually working.
Statistic Callout: Healthy email programs in healthcare aim for deliverability above 95%, with open rates in the 22 to 26% range considered average and 35%+ considered strong.
Email and automation metrics matter more than most clinics realize:
- Deliverability above 95% (below that, your emails are landing in spam and skewing every downstream metric)
- Open rate in the 22 to 26% range as an average benchmark, 35%+ as a strong result
- Lead response time, the minutes or hours between a lead submission and your first outreach, which correlates directly with whether that lead ever books
- Automation efficiency, meaning how much of your follow-up sequence runs without manual staff intervention
How to Measure Healthcare Marketing KPIs Without Guessing
You can’t calculate any of the KPIs above accurately without the right instrumentation. This is where most in-house marketing efforts fall apart, not in strategy, but in plumbing.
Build a four-part measurement stack, making sure it’s integrated with your practice management system:
- UTM parameters on every campaign link, consistently structured, so every session in Google Analytics 4 can be traced to a specific ad, keyword, or email send.
- Call tracking with dynamic number insertion, which swaps the phone number shown on your site based on the visitor’s traffic source. Without this, every phone-booked patient looks like they came from nowhere.
- An intake-source field in your booking form or front-desk script, asking new patients directly how they heard about you. This catches word-of-mouth and offline referrals that digital tracking misses entirely.
- Practice management system (PMS) booking data, which is the only source of truth for whether an appointment actually happened and what revenue it generated.
This combination is what Zocdoc recommends specifically because it closes the gap between digital attribution and what really happened in your waiting room.
Multi-touch attribution beats last-click for a simple reason: patients rarely convert on their first interaction. Someone might see a Facebook ad, later search your clinic name on Google, then call after reading a review.
To join your data, match records by booking ID or patient ID across GA4, your CRM, and your PMS. A typical flow: GA4 captures the session and campaign source, your CRM logs the lead and its intake-source tag, and your PMS confirms whether the appointment was kept and what it billed. Reconciling these weekly, rather than trying to do it in real time, is usually the sustainable approach for a small marketing team.
One compliance note that can’t be skipped: any vendor touching protected health information, including call-tracking or CRM tools that store patient names or phone numbers, needs a signed Business Associate Agreement (BAA) under HIPAA before you connect them to your stack.
Pro Tip: Start your instrumentation audit with one channel, not all of them. Pick your highest-spend channel, get UTMs, call tracking, and intake-source working cleanly for that one, then replicate the setup elsewhere. Trying to fix everything simultaneously is how these projects stall for months.
Building a Weekly, Monthly, and Quarterly KPI Dashboard
Different people need different numbers at different speeds. A front desk manager doesn’t need quarterly ROI trends, and your CFO doesn’t need daily bookings by channel. Match the cadence to the decision it supports.
Weekly dashboards should show bookings by channel, cost per booked appointment, and show rate. This is the operational view for front desk staff and whoever manages your ad accounts day to day. It answers “is anything broken right now?”
Monthly reporting should cover new patient acquisition cost by service line, channel conversion rates, and retention cohorts. This is the view your marketing director or operations lead uses to shift budget between channels before the quarter’s spend is locked in.
Quarterly reviews belong at the CFO or board level, and the headline numbers are marketing-attributed revenue and ROI calculated through PLV logic, not just immediate visit value.
| Cadence | Core metrics | Primary audience | System of record |
|---|---|---|---|
| Weekly | Bookings by channel, cost per booked appointment, show rate | Front desk, ad ops | GA4, call tracking |
| Monthly | PAC by service line, channel conversion rate, retention cohorts | Marketing director, ops lead | CRM, intake-source data |
| Quarterly | Marketing-attributed revenue, PLV-based ROI | CFO, board | PMS, blended data |
Keep your visualization set minimal. The one chart every stakeholder eventually asks for is a simple bar chart answering “which channels produced revenue this quarter?” Build that first before adding anything fancier.
Healthcare Marketing Benchmarks and Realistic Targets
Benchmarks are context, not a scoreboard. A pain management clinic and a mental health practice can have wildly different acceptable PAC ranges because their average visit value and patient retention differ so much.
Percentile bands rather than single averages give you a more honest read on performance, since a single “industry average” number flattens the difference between a top-quartile campaign and a mediocre one.
Some working reference points worth knowing:
- A PLV-to-PAC ratio around 3:1 is a reasonable working target across most specialties; below that, the math on sustainable growth starts to strain.
- Paid search click-through and cost-per-click ranges vary heavily by specialty and geography, with rising CPCs a consistent trend heading into 2026.
- Email open rates in the 22 to 26% band are typical, with deliverability above 95% as the baseline health check.
- Cross-specialty comparisons mislead because funnel depth differs. A single dental visit and a multi-year physical therapy relationship will never share the same acceptable PAC.
Compare your numbers to your own service line’s history first, and to specialty-specific benchmarks second. General “healthcare marketing” averages are a poor third choice.
Common KPI Measurement Mistakes and a 90-Day Fix
Four mistakes distort more healthcare marketing decisions than any strategic error does. Counting leads instead of bookings inflates apparent performance and hides which channels actually fill your calendar. Last-click attribution starves upper-funnel channels like content and social that start the patient journey but rarely close it. Ignoring show rate makes a bad channel look acceptable because the appointment “counted” even though the patient never walked in. And underinvesting in retention means you keep paying full acquisition cost for patients you could have kept with a better recall program.
Here’s a realistic 90-day sequence to fix the worst of it:
- Weeks 1 to 3: Instrument one high-spend channel end-to-end with UTMs and call tracking.
- Weeks 4 to 6: Add an intake-source field to every booking form and front-desk script.
- Weeks 7 to 9: Calculate real PAC and PLV for that one channel and set your first ratio benchmark.
- Weeks 10 to 12: Establish a 90-day review cadence and roll instrumentation out to a second channel.
Two quick wins pay off almost immediately: fixing booking page friction (reducing form fields, adding a phone-tap button) and setting up automated weekly reports so nobody has to build spreadsheets from scratch every Monday.
How to Segment KPIs by Specialty and Service Line
A pain management clinic, a med spa, and a mental health practice should not be measured against the same PAC target, because their booking cycles and visit economics differ fundamentally.
A med spa often has an impulse-driven booking cycle, so cost per booked appointment and short-term conversion rate matter more than long retention modeling, since many treatments are single visits or short series.
A mental health or behavioral health practice looks almost opposite. The first session rarely closes the sale. Show rate becomes critical here because no-shows are historically higher in behavioral health, and PLV calculations need to account for a multi-month or multi-year treatment relationship rather than a single visit.
A pain management or physical therapy clinic sits somewhere in between, with moderate visit frequency and a real retention curve worth modeling into PLV.
Segmenting your dashboard by service line, not just by clinic-wide averages, exposes which specialty is actually driving your best ROI. We’ve seen clinics discover that a service line they treated as secondary was quietly outperforming their flagship offering once PAC and PLV were broken out separately. If you run a multi-service practice, this single change to your reporting structure often surfaces the biggest insight of the quarter.
Where Patient Satisfaction and NPS Fit Into Marketing Measurement
Net Promoter Score (NPS) and patient satisfaction scores aren’t traditional acquisition metrics, but they belong on a marketing dashboard because they predict two things that acquisition numbers can’t: referral volume and retention.
A high NPS practice generates word-of-mouth referrals that show up in your intake-source data as “friend or family,” often at close to zero acquisition cost. When that category shrinks over time, it’s frequently a leading indicator of a satisfaction problem before online reviews even reflect it.

Satisfaction data also feeds directly back into PLV. A patient who rates their experience poorly is a retention risk, and retention is one of the two variables (along with visit value) that determines lifetime value. Tracking NPS quarterly alongside your other KPIs gives you an early warning system, letting you address a declining experience before it shows up as a shrinking retention cohort three months later.
Digital Presence KPIs: Traffic, Bounce Rate, and Search Rankings
Website traffic, bounce rate, and organic search rankings are upstream indicators. They don’t generate revenue directly, but they set the ceiling on how many people ever reach your booking form.
Rising organic traffic with a stable or improving conversion rate is a good sign your search engine optimization work is compounding. Rising traffic with a flat or declining booking rate usually means you’re attracting the wrong audience, or your landing pages aren’t doing their job once visitors arrive.
Bounce rate matters most on your highest-intent pages, meaning your service pages and booking forms, not your blog. A high bounce rate on a “book a consultation” page usually points to page speed problems, unclear next steps, or a mismatch between what your ad promised and what the page delivers.
Search ranking position for your core service and location terms is worth tracking monthly, not because rank alone pays bills, but because it’s a leading indicator of the organic traffic and inquiries you’ll see over the following weeks. Treat digital presence KPIs as a health check on your funnel’s top, and keep them separate from your revenue-tied metrics so one doesn’t get mistaken for the other.
Social Media Metrics That Actually Matter for Healthcare
Follower counts and likes are the least useful numbers on a healthcare marketing dashboard, and yet they’re often the ones a practice owner asks about first. Redirect that attention toward metrics that connect to bookings.
Click-through rate from social posts and ads to your booking page tells you whether your content is actually motivating action, not just generating passive engagement. Comment sentiment and direct message volume are worth monitoring qualitatively, especially in specialties like mental health or aesthetics where patients often reach out with questions before booking.
Paid social conversion rate, tracked the same way as paid search through UTMs and intake-source tagging, lets you compare social spend against search spend on equal footing. In our experience, social tends to perform well for top-of-funnel awareness and poorly for immediate bookings compared to search, which makes sense given that search captures people already looking for care while social interrupts people who weren’t necessarily looking yet. That doesn’t make social a bad channel. It makes it a different kind of channel that needs a different KPI expectation.
Benchmarking Against Competitor Performance
You can’t see a competing clinic’s actual PAC or conversion rate, but you can benchmark the signals that are publicly visible: their ad presence, review volume and rating trend, and organic search visibility for your shared target keywords.
Track how many paid search and social ads a competitor is running over time using any ad transparency tool, since a sudden increase usually signals they’re scaling a channel that’s working for them. Watch their review velocity, meaning how many new reviews they’re accumulating per month, as a rough proxy for patient volume and satisfaction trends.
Organic visibility is the most measurable piece. If a competing practice consistently outranks you for your core service terms in your area, that’s a concrete, trackable gap rather than a guess. None of this replaces your own KPI discipline, but it puts your numbers in context. A PAC that looks high in isolation might be perfectly reasonable if competitors are bidding up the same keywords across the board.
The Real Reason KPI Discipline Wins Budget Conversations
Showing a CFO “we generated 200 leads” invites skepticism. Showing them “we spent $14,000 and it produced $61,000 in projected patient lifetime value at a 4.3:1 ratio” invites a follow-up question about scaling the budget, not cutting it. That shift, from activity metrics to dollars-per-booked-visit, is what separates marketing teams that keep their budgets from those that get trimmed every downturn.
Measurement discipline also changes internal behavior. Teams stop celebrating a viral post or a cheap lead and start asking whether it turned into a kept appointment. Small instrumentation wins, a working intake-source field here, a properly tagged campaign there, compound over several quarters into a genuinely trustworthy revenue picture.
— Felix
Getting Your KPI Tracking Instrumented Correctly
Most clinics that come to Adjetmarketing already have Google Analytics installed and a CRM they barely use. What they’re usually missing is the connective tissue: call tracking, a clean intake-source field, and a dashboard that pulls it all into one weekly view instead of three disconnected spreadsheets. That gap is exactly what makes PAC and PLV numbers unreliable, and it’s the first thing worth fixing before spending another dollar on new campaigns.
A typical engagement starts with an instrumentation audit, checking what’s tracked and what’s missing, followed by a pilot on your highest-spend channel, then a dashboard build and a handoff to your staff with ongoing reporting support. If you manage Google Ads for a medical clinic or aesthetic practice and want the numbers behind it to actually hold up in a budget conversation, start with the medical clinic marketing checklist to see where your own measurement gaps likely are.
Sources
- Healthcare marketing ROI (Zocdoc resources blog)
- 6 healthcare marketing KPIs you must track in 2026 (Cured)
- Healthcare Marketing Benchmarks 2026 (Benchmarketing)
- Healthcare marketing metrics for patient growth in 2026 (Evokad)
FAQ
What are the 5 key performance indicators in healthcare marketing?
The five most cited are patient acquisition cost, cost per booked appointment, patient lifetime value, appointment show rate, and marketing-attributed revenue or ROI, since these tie directly to booked and kept patient visits.
What are the 5 P’s of healthcare marketing?
The traditional marketing mix (product, price, place, promotion, people) is sometimes extended to healthcare, but there’s no single universally agreed “5 P’s” framework specific to the industry, and definitions vary by source.
What are the 5 key performance indicators in marketing generally?
Outside healthcare, common core marketing KPIs are cost per acquisition, conversion rate, customer lifetime value, return on ad spend, and customer retention rate, all of which map closely to the healthcare-specific versions covered above.
How do you measure healthcare marketing success beyond leads?
Measure booked-and-kept appointments and revenue, not raw lead volume, by joining your GA4 session data, CRM lead records, and practice management system booking data using a shared booking or patient ID.
What is a good PAC-to-PLV ratio for a clinic?
A PLV-to-PAC ratio around 3:1 is a reasonable working target for most specialties, meaning a patient’s lifetime value should run at least three times what it cost to acquire them.
How can Adjetmarketing help with KPI tracking?
Adjetmarketing runs an instrumentation audit, pilots proper tracking on your top channel, and builds a weekly-to-quarterly dashboard so your PAC, PLV, and ROI numbers hold up in real budget conversations.