









A healthy B2B lead-to-appointment rate typically falls within a broad range, varying significantly by lead source and intent. If you’re inside that range, your funnel is working; below it, the fix usually starts with splitting set rate from show rate before touching anything else. HubSpot’s sales data and a structured 90-day sprint are the two tools we lean on most to get teams unstuck.
TL;DR:
- Cold calling generally achieves a lead-to-appointment rate of 6% to 10%, while cold email conversion rates remain in the low single digits unless highly personalized.
- Tracking the correct events, including lead creation, first contact, appointment set, and attendance, is essential for accurate measurement of lead-to-appointment and show rates.
- A low lead-to-appointment rate often results from data issues, weak outreach, or booking friction, which should be diagnosed by splitting set and show rate assessments.
- Improving speed-to-contact and simplifying booking processes can increase appointment set and show rates within a 30 to 90-day window.
- Establishing baseline metrics over two weeks and testing one variable at a time is crucial for meaningful progress and realistic target setting.
Table of Contents
- What the metric measures and related metrics you must track
- Benchmarks: realistic ranges by channel and common B2B segments
- How to calculate and track lead-to-appointment rate in practice
- Diagnosing a low lead-to-appointment rate: split the leak and test assumptions
- Tactics that move the needle: prioritized playbook for 30 to 90 days
- Measurement, targets, and an experiments cadence
- AdJet Marketing’s 90 Day Playbook: reducing no-shows and increasing booked appointments
- Practitioner perspective: mistakes we see and prioritization guidance
- How AdJet can help: relevant services and the next step
- FAQ
- Sources
What the metric measures and related metrics you must track
Lead-to-appointment rate tells you what share of raw leads turn into a scheduled, confirmed appointment. It is not the same as show rate or close rate, and conflating them is the single most common measurement mistake we see in B2B pipelines.
The formula is simple:
- Lead-to-appointment rate = (Appointments Set ÷ Total Leads) × 100. If you generate 500 leads and set 40 appointments, your rate is 8%.
- Show rate = (Appointments Attended ÷ Appointments Set) × 100.
- Appointment-to-close rate = (Deals Closed ÷ Appointments Attended) × 100.
Each metric answers a different question, so each needs its own target and its own fix:
- Lead-to-appointment rate diagnoses whether your outreach and offer are compelling enough to get a booking.
- Show rate diagnoses whether your confirmation and reminder process is strong enough to get people to actually attend.
- Appointment-to-close rate diagnoses whether your sales conversation and offer match the lead’s actual need.
Reporting hygiene matters more than most teams assume. Deduplicate leads before calculating any rate, since a single contact re-entering your CRM through two channels will quietly inflate your lead count and deflate every downstream percentage. Use one consistent event trigger for “appointment set” across your CRM and calendar tool, because a booking logged in Calendly but not synced to your CRM creates a silent gap. Watch attribution windows too: a lead that books 20 days after first contact should still be credited to the original source, not misattributed to whatever touchpoint happened to be logged last.
Benchmarks: realistic ranges by channel and common B2B segments
Ranges vary this widely because channel, offer complexity, and lead intent are not comparable across the board. A cold list and an inbound demo request are different animals, and benchmarking them against the same number sets you up to misread your own results.
Most active cold callers convert to appointments in the 6% to 10% range, according to HubSpot’s sales statistics, and that figure reflects reps who call consistently rather than occasional outreach. Cold email tends to run lower, often in the low single digits unless personalization and list quality are strong, in which case rates can climb toward the low teens. Inbound and referral leads sit at the top of the range, frequently doubling or tripling cold-channel numbers because the prospect already arrives with intent.
- Cold calling: roughly 6% to 10% for consistent callers.
- Cold email: low single digits, higher with strong personalization.
- Paid ads and landing pages: wide range, often 2% to 20% depending on offer clarity.
- Inbound and referral: typically the highest converting source in a B2B funnel.
Segment matters too. SaaS demo requests tend to convert well because the ask is low-friction and familiar to the buyer. Professional services leads often need more nurturing before a booking feels worthwhile, which can suppress the rate even when lead quality is fine. Healthcare-facing appointments, including the clinic and med spa funnels we manage most often, carry more offer complexity: patients weigh cost, timing, and trust before booking, so rates can run lower than a typical B2B SaaS funnel even when every other variable is dialed in.
A few caveats keep these ranges honest. Offer friction such as requiring insurance details upfront will suppress your rate regardless of channel quality. And a rate that looks low might simply reflect a mismatch between your ICP and the leads you’re buying, not a broken funnel. Before chasing a fix, ask whether the campaign was built for buying intent or for awareness, since those two goals produce very different booking rates by design.
How to calculate and track lead-to-appointment rate in practice
Reliable tracking starts with capturing the right events in your CRM, not with a fancier dashboard.
- Log four events for every lead: lead created, first contact attempt, appointment set, appointment attended. Missing any one of these breaks your ability to calculate set rate or show rate separately.
- Tag every lead with its source and campaign at creation, using UTM parameters for paid and organic traffic and a manual field for calls, referrals, or events.
- Calculate three numbers weekly: lead-to-set rate, set-to-show rate, and net lead-to-show rate (Appointments Attended ÷ Total Leads). The third number is the one that actually reflects revenue-generating capacity.
A worked example: 200 leads come in, 24 become set appointments, and 18 of those show up.
Keep the weekly scorecard compact:
- Leads in, by source
- Appointments set
- Appointments shown
- Set rate and show rate
- Time-to-first-contact (in hours)
Cohort your data by week and by source rather than looking at a single blended number. A campaign launched two weeks ago needs its own cohort view, because blending it with a six-month-old campaign hides whether the new source is actually underperforming or just immature.
Diagnosing a low lead-to-appointment rate: split the leak and test assumptions
A low rate has three possible causes: bad leads, weak outreach, or booking friction. Most teams guess instead of checking, which wastes weeks on the wrong fix.
- Verify data integrity first. Deduplicate your lead list and confirm attribution is tagging sources correctly. A 5% rate that’s really a 9% rate with duplicate leads sitting in the denominator is not a lead quality problem, it’s a data problem.
- Split the funnel into set rate and show rate, by channel. A healthy set rate paired with a poor show rate points to confirmation and reminder gaps, not lead quality. A poor set rate across every channel points upstream, to the offer or the outreach cadence itself.
- Run a qualitative audit. Listen to a sample of calls, review message scripts, and check the actual booking page a lead sees. Numbers tell you where the leak is; a handful of recorded calls tells you why.
- Test low-cost fixes before structural ones. Try a faster speed-to-contact window, a simplified landing page, or an alternate call-to-action before rebuilding an entire campaign.
Pro Tip: Run the set-versus-show split before anything else. We’ve seen clinics blame their ad targeting for months when the real issue was a confirmation email that never mentioned a time zone.
Tactics that move the needle: prioritized playbook for 30 to 90 days
Start with the cheapest, fastest changes, then move to anything that touches staffing or creative.
Quick wins come first. Cutting time-to-first-contact from hours to minutes consistently lifts set rates, since a lead that just filled out a form is far more likely to answer a call in the next five minutes than the next day. Adding an SMS touch alongside the call catches people who screen unknown numbers. Simplifying the booking page to a single-click calendar, instead of a multi-field form followed by a separate scheduling email, removes a step that loses people every time.
Confirmation and reminder cadence close the show-rate gap:
- Send an immediate confirmation the moment a booking is made.
- Follow with a reminder 48 hours before the appointment.
- Send a second reminder 24 hours out.
- Send a final SMS reminder one hour before.
Booking UX changes often outperform ad spend increases. Reduce form fields to the minimum needed to qualify the lead, state the appointment’s purpose clearly so there’s no ambiguity about what happens next, and decide upfront whether you’re pre-qualifying before the call or screening after the booking, since mixing both creates friction without adding value.
Rep-level fixes matter just as much as anything on the page. Standardized scripts reduce the variance between your best and worst performer. Coaching on objection handling for the first thirty seconds of a call pays off disproportionately, since that’s where most bookings are won or lost. Dedicated booking specialists, separate from closers, tend to outperform generalists who split time across both roles. And staffing should align to your ad windows: if your Google Ads budget pushes most clicks between 9 AM and 1 PM, your fastest responders need to be scheduled for that window, not the end of the day.
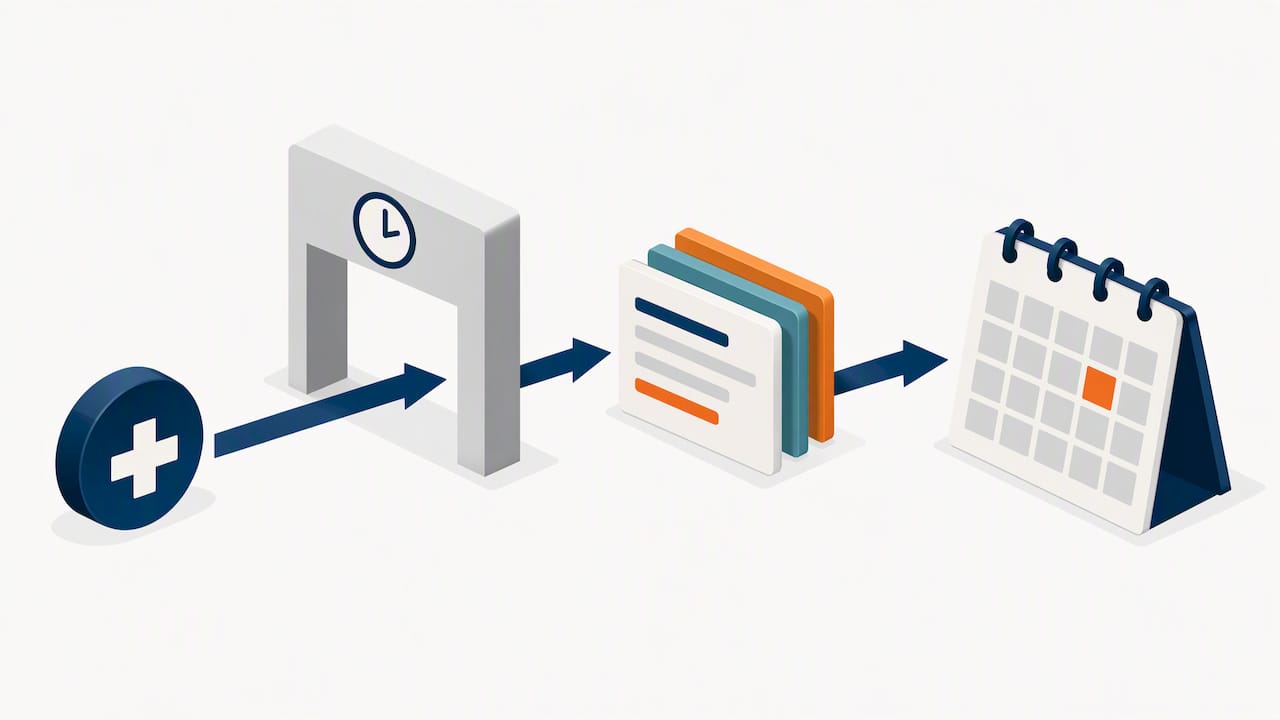
Pro Tip: Fix confirmations and speed-to-contact before you touch creative. Changing ad copy or redesigning a landing page is expensive and slow to test; reminder cadence is free and shows results within a week.
Only move to creative changes, ad copy, landing page redesigns, or a full offer rework, once the operational basics are solid. Otherwise you’re optimizing a leaky bucket.
Measurement, targets, and an experiments cadence
Set your 30, 60, and 90-day targets from your own baseline, not an industry average, since your baseline already accounts for your specific lead mix and offer.
- Establish your baseline over a minimum two-week window to avoid single-day noise skewing the number.
- Set incremental targets: a realistic 90-day goal is often a 2 to 4 percentage point lift in net lead-to-show rate, not a doubling.
- Run one variable at a time per experiment, and wait for at least 50 to 100 leads per variant before drawing conclusions, since smaller samples produce misleading swings.
- Read cohort results by week, not by cumulative total, so a slow first week doesn’t mask a strong second week or vice versa.
- Run a minimum viable experiment in one week: change only your confirmation sequence (add an SMS reminder) and compare show rate against the prior two weeks’ average.
AdJet Marketing’s 90 Day Playbook: reducing no-shows and increasing booked appointments
Our 90 Day Sprint sequences fixes so each month isolates a variable instead of changing everything at once.
- Month one: fix data tracking, launch confirmation sequences with SMS reminders, and establish the baseline scorecard.
- Month three: refine ad targeting and creative using the clean set-rate and show-rate data from the prior two months.
Clients review KPIs regularly and a full scorecard monthly, so progress is measurable at every checkpoint.
Practitioner perspective: mistakes we see and prioritization guidance
The most common misdiagnosis we encounter is blaming lead sources before checking booking friction. Many clinics come to us convinced their ads are broken when the real problem is a confirmation email that never arrives. Our rule: measure first, fix quick wins second, and only consider structural changes, new staffing, or a rebuilt offer, once the data rules out the cheaper fixes. If your team is stretched thin on speed-to-contact, that’s usually the moment to bring in agency support or a dedicated booking specialist rather than adding more ad spend.
— Felix
How AdJet can help: relevant services and the next step
If you’d rather hand off the execution, our services map directly to the leaks outlined above. We build landing pages designed around a single clear call-to-action, manage Google Ads campaigns so paid traffic matches your offer’s intent, and run conversion rate optimization to tighten booking UX without a full rebuild.
- Landing-page design and rebuilds for clinics and service businesses losing leads to booking friction.
- Google Ads management aligned to appointment-ready intent rather than broad awareness traffic.
- Confirmation sequencing and CRO work to lift show rate once set rate is healthy.
A typical 90-day engagement follows the same sequence described above: fix tracking and confirmations first, then landing pages, then ad targeting. If you want a second set of eyes on where your funnel is leaking, start with a landing page review.
FAQ
What is a good appointment setting rate?
Consistent cold callers often land in the 6% to 10% range, while inbound and referral leads tend to convert well above that.
What is a good lead conversion rate?
Lead conversion rate depends on which stage you’re measuring: lead-to-appointment, appointment-to-show, or appointment-to-close.
Is 2.5% a good conversion rate?
Cold outreach often runs near this level, while inbound or referral sources should perform noticeably higher, so the right read depends on where the leads came from.
What is a lead rate?
Lead rate typically refers to the percentage of a given audience, such as website visitors or call recipients, that becomes a qualified lead. It’s a step earlier in the funnel than lead-to-appointment rate, which measures what happens to leads after they already exist.