









Run a field check in Search Console and a lab test in PageSpeed Insights today, then fix whichever Core Web Vital is failing hardest before touching anything else. Most clinic sites lose patients to a single dominant bottleneck, often an oversized hero image dragging down LCP. Quick wins like image compression, deferred scripts, and a CDN often cut load times within days.
TL;DR:
- Google’s targets are LCP at 2.5 seconds, INP at 200 milliseconds, and CLS at or below its good stability threshold, measured at the 75th percentile.
- Use PageSpeed Insights and WebPageTest for lab diagnosis, then check Search Console field data because lab scores alone do not reflect patient visits.
- Cache public service pages and serve static assets through a CDN, but never cache patient specific pages or send identifiable content through it.
- Test one change at a time, then monitor field data for about two weeks; booking and search gains may take six to twelve weeks.
Table of Contents
- Why speed matters for healthcare websites
- Core Web Vitals explained for clinic sites
- How to measure site speed: tools and when to use them
- Quick diagnostics checklist: high-impact fixes for this week
- A practical sequence to fix performance
- Monitoring and testing workflow
- Field-proven patterns from AdJet Marketing
- Speed, compliance, and accessibility on healthcare sites
- WordPress optimization strategies for healthcare sites
- Balancing speed and security on healthcare sites
- Realistic timelines for healthcare site performance
- How AdJet Marketing can help
- FAQ
- Sources
Why speed matters for healthcare websites
A slow page costs you patients before they ever see your services. When someone searching for a same-day appointment hits a homepage that takes several seconds to load, many simply back out and call the next clinic on the list. That abandoned booking form or unanswered click-to-call button represents a real patient who needed care and found it somewhere faster.
Google’s Web Vitals framework separates loading, responsiveness, and visual stability into three measurable signals, and it recommends judging performance at the 75th percentile across mobile and desktop users rather than a single best-case test. Field data, not lab data, is what actually feeds into search ranking signals, which means the real-world experience of your average visitor on a mid-range phone matters more than how your site performs on a fast office desktop.
Beyond rankings, speed is a trust signal. A clinic site that stutters and jumps around as it loads reads as unpolished, and patients researching a provider for something as personal as their health notice that friction. The Americans with Disabilities Act guidance on digital accessibility also reinforces that a usable site, one that loads predictably and responds to input without delay, is part of serving patients fairly, including those using assistive technology or slower connections.
A few patterns show up again and again on clinic sites:
- Appointment forms that time out or freeze on mobile during peak evening traffic.
- Hero banners and before-and-after galleries that load at full resolution, stalling the page.
- Chat widgets and review plugins that load before the booking button becomes clickable.
A page that loads within 2.5 seconds for the LCP target gives patients a usable booking experience from the first interaction, which is the baseline worth protecting before any other optimization.
Core Web Vitals explained for clinic sites
Three metrics make up Core Web Vitals, and each one maps to a different moment in a patient’s visit.
Largest Contentful Paint (LCP) measures how long it takes the biggest visible element, often a hero image or headline block, to render. Google’s target is roughly 2.5 seconds at the 75th percentile. On clinic sites, the usual culprit is an unoptimized banner photo or a slider plugin loading several large images at once before showing any of them.
Interaction to Next Paint (INP), which replaced the older Total Blocking Time metric in most reporting, measures how quickly the page responds when a patient taps the booking button or starts typing into a contact form. A target of about 200 milliseconds helps keep that interaction feeling instant. Heavy JavaScript from appointment widgets, live chat tools, or tracking pixels is the usual drag here.
Cumulative Layout Shift (CLS) tracks how much the page jumps around as it finishes loading, with a target at or below the recognized threshold for good visual stability. Ads, late-loading reviews widgets, and images without reserved dimensions are the most common causes on clinic pages. A visitor trying to tap “Book Now” just as a chat bubble pops in and shifts the layout often ends up clicking the wrong thing entirely, which erodes trust fast.
- LCP failures usually trace back to one oversized image or a slow server response.
- INP failures usually trace back to third-party scripts competing for the main thread.
- CLS failures usually trace back to content injected after the initial layout settles.
When you’re deciding what to fix first, prioritize whichever metric is actually blocking the booking or call action, not whichever is easiest to fix.
Pro Tip: Check which Core Web Vital is failing on your actual booking or contact page, not just the homepage. That’s the page where a slow response costs you the most.
How to measure site speed: tools and when to use them
Before changing anything, you need a clear picture of where the problem actually lives. That means running both lab tests, which simulate a page load under controlled conditions, and field tests, which reflect what real patients experienced on real devices and connections.
- Start with PageSpeed Insights, which returns both a Lighthouse lab report and, when enough traffic exists, real field data from the Chrome User Experience Report, giving you Core Web Vitals scores alongside a prioritized list of fixes.
- Run the same URL through WebPageTest for a deeper view: its waterfall chart and filmstrip show exactly which request is holding up your LCP element and how long each script takes to execute.
- Check Google Search Console’s Core Web Vitals report for a site-wide view of which URLs are failing in the field, grouped by issue, which is useful when a clinic has dozens of service pages built from the same template.
- For ongoing monitoring, consider instrumenting the open-source web-vitals library to collect real-user data continuously rather than relying on periodic spot checks.
Lab tools are fast and repeatable, which makes them ideal for testing a specific fix before you ship it. Field data is slower to accumulate but tells you whether that fix actually helped the patients visiting your site, since web.dev’s own guidance recommends using both together rather than trusting either alone.
| Tool | Data type | Best use |
|---|---|---|
| PageSpeed Insights | Lab plus field (when available) | Quick overall snapshot and fix suggestions |
| WebPageTest | Lab | Resource-level diagnosis, waterfall, filmstrip |
| Search Console | Field | Site-wide real-user trends by URL |
| web-vitals library | Field | Continuous real-user monitoring |
Quick diagnostics checklist: high-impact fixes for this week
Once you know which metric is failing, a handful of changes tend to produce the biggest visible improvement for the least engineering effort.
- Resize and compress every large image, convert to WebP or AVIF where your platform supports it, reserve width and height attributes so the browser doesn’t shift layout, and lazy-load anything below the fold.
- Audit third-party scripts, booking widgets, chat tools, review plugins, and analytics tags, and defer or load them asynchronously so they don’t block the main thread while a patient tries to click.
- Turn on browser caching with proper cache-control headers, and route static assets like images and stylesheets through a content delivery network.
- Minify CSS and JavaScript, inline the critical styles needed for the first screen, and remove unused plugins or page-builder bloat that’s loading code nobody uses.
- Re-test with WebPageTest and recheck Search Console’s field data over the following two weeks to confirm the change actually moved the numbers for real visitors, not just in the lab.
Pro Tip: Fix one category at a time, images first, then scripts, then caching, so you can tell which change actually produced the improvement.
A practical sequence to fix performance
Clinics often have limited developer time, so prioritizing which performance issues to fix first is crucial to effective improvement.
- Start by diagnosing the dominant bottleneck with a WebPageTest waterfall and your Search Console field data, since fixing the wrong metric wastes effort.
- Address the LCP resource first, usually an image or a slow server response, since it affects every single visitor regardless of how they interact with the page.
- Move to interactivity tasks next: defer or remove scripts that compete with booking buttons and forms for the main thread.
- Clean up CLS issues last among the Core Web Vitals, reserving space for ads, embeds, and widgets so nothing jumps once it finishes loading.
- Reduce total page weight broadly: fewer plugins, lighter page-builder templates, and trimmed fonts all help every metric at once.
Small fixes, image compression, script deferral, caching setup, typically take a few days to a couple of weeks and rarely require a developer with deep platform experience. Larger engineering work, migrating hosting, rebuilding a bloated page-builder template, or restructuring how a site loads third-party tools, is a multi-week project and usually signals it’s time to bring in help rather than patch around the problem indefinitely.
Signs you’ve outgrown quick fixes: your hosting plan is shared and maxed out, your site runs on a page builder with years of accumulated plugins, or every fix you try gets undone by the next content update. At that point, a hosting upgrade or a rebuilt template, rather than another round of compression, is usually the better investment.
Monitoring and testing workflow
Fixing performance once isn’t the same as keeping it fixed. New plugins, added tracking pixels, and content updates all tend to erode gains over time if nobody’s watching.
- Set clear KPIs: 75th-percentile LCP, INP, and CLS for both mobile and desktop, plus your actual booking conversion rate, since Core Web Vitals should be judged at that percentile rather than a single best run, according to web.dev’s guidance.
- Make one change at a time, confirm it in a lab test immediately, then give it roughly two weeks of field monitoring before deciding whether it worked and moving to the next fix.
- Instrument continuous real-user monitoring where possible, and schedule recurring WebPageTest runs alongside periodic Search Console checks so you’re not relying on memory to catch regressions.
A meaningful improvement shows up consistently across field data over time, not just in a single lab score, which is why patience during the monitoring window matters more than chasing a perfect Lighthouse number.
Distinguishing real improvement from noise comes down to consistency: if your 75th-percentile LCP drops and stays down across two weeks of field data rather than bouncing around, the fix worked. A single good test run tells you very little on its own.
Field-proven patterns from AdJet Marketing
Across clinic sites, common performance issues include unoptimized hero images affecting LCP, booking widgets loading before main content, and lack of caching configuration. Typical fixes involve image compression and resizing, deferring unnecessary scripts, and using a CDN for static assets.
DIY works well for straightforward image and caching fixes. Hiring help makes more sense when developer access is limited, when a fix risks breaking a booking form a clinic can’t afford to have down, or when speed work needs to tie directly into conversion optimization rather than stopping at a Lighthouse score.
Speed, compliance, and accessibility on healthcare sites
Speed and accessibility are more connected than they first appear. A page that loads slowly on a budget phone or a weaker connection effectively excludes the patients relying on those devices, including many older patients and those in areas with limited broadband. The ADA’s digital accessibility guidance treats a usable, responsive experience as part of equal access, and a site riddled with layout shifts or unresponsive buttons creates real barriers for patients using screen readers or assistive navigation tools.
There’s a compliance angle too, separate from accessibility. Many clinic sites load third-party scripts, chat widgets, review plugins, analytics tags, that can introduce privacy and data-handling questions if they’re not configured carefully, particularly anything that might touch patient-submitted information. Keeping script loading intentional, loading only what you’ve vetted, and deferring everything else, serves both speed and cleaner data practices at the same time.
Practically, that means treating your accessibility and performance work as the same project rather than two separate checklists. Reserved image dimensions prevent layout shift and also prevent disorienting jumps for patients using screen magnification. Deferred third-party scripts speed up interactivity and also reduce the number of external connections your site makes without a clear purpose. Fixing speed well tends to fix a surprising number of accessibility gaps along the way.
WordPress optimization strategies for healthcare sites
Most clinic sites run on WordPress, and the platform’s flexibility is exactly what tends to slow them down. Page builders, accumulated plugins, and themes built for general use rather than clinical content all add weight that a patient’s browser has to process before anything appears.
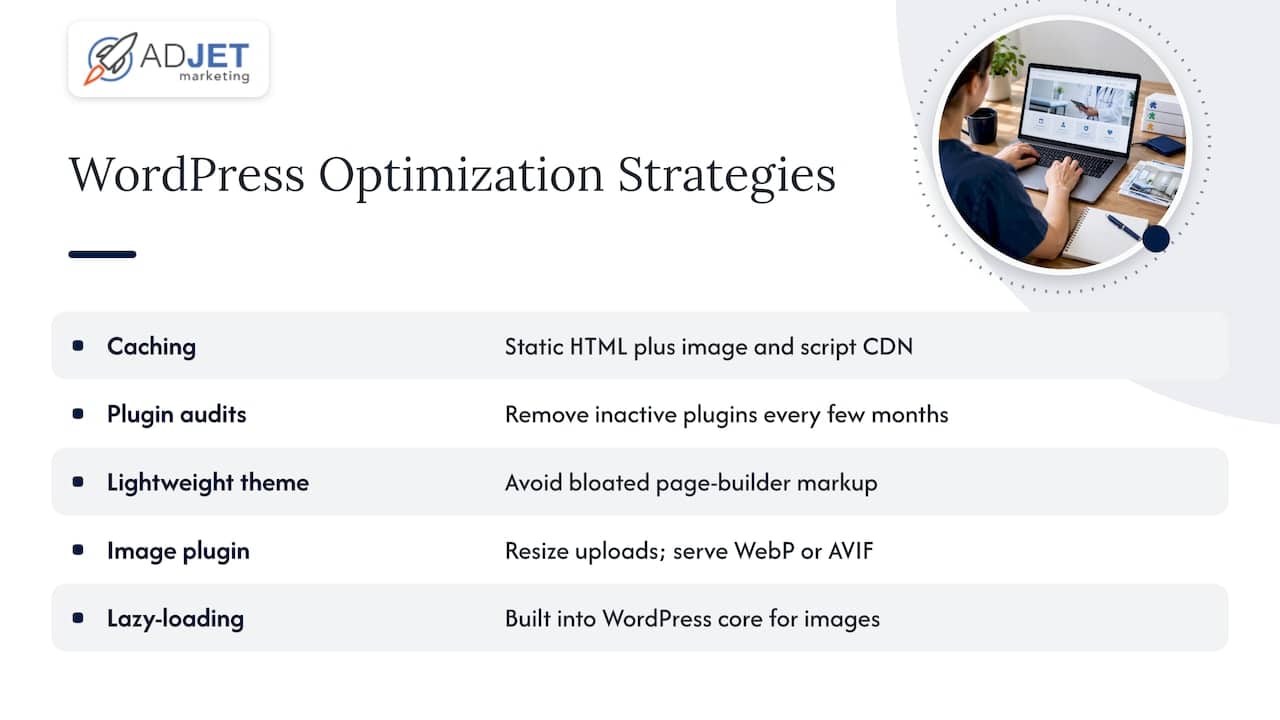
A few WordPress-specific habits make the biggest difference. Choose a caching plugin that generates static HTML rather than rebuilding pages on every visit, and pair it with a CDN for images and scripts. Audit installed plugins every few months and remove anything not actively in use, since dormant plugins often still load code on every page view. Favor a lightweight theme over a heavy page-builder template when possible, since many page builders generate bloated markup that’s hard to trim later.
Image handling deserves particular attention on WordPress clinic sites, since galleries, before-and-after photos, and team headshots are often uploaded at full camera resolution. A plugin that automatically resizes and serves WebP or AVIF versions solves most of this without manual work on every upload. Lazy-loading, now built into WordPress core for images, handles much of the below-the-fold deferral automatically, though it’s worth verifying it’s actually enabled and working on your specific theme.
Finally, be cautious with security and SEO plugins that run deep scans or inject scripts on every page load. They’re often necessary, but stacking several at once compounds their performance cost, and it’s worth testing whether one well-configured plugin can replace two or three overlapping ones.
Balancing speed and security on healthcare sites
Performance fixes and security requirements can pull in opposite directions if you’re not careful. A CDN speeds up delivery but means static assets are served from outside your primary hosting environment, which is fine for images and scripts but worth avoiding for anything that might contain patient-identifiable content. Caching speeds up repeat visits but should never cache a page that displays personalized or patient-specific information.
The safer approach is to separate what gets aggressively optimized from what doesn’t. Public-facing content, service pages, provider bios, general information, can be cached, compressed, and served through a CDN without concern. Anything behind a login, a patient portal, a secure messaging form, should be handled with more conservative settings that prioritize encryption and access control over raw speed.
Third-party scripts deserve the same scrutiny from a security angle as from a performance angle. A chat widget or scheduling tool that’s slow is also a script with access to whatever a patient types into it, so vetting these tools for both speed and data handling before installing them protects you on two fronts at once. When in doubt, favor fewer, well-vetted tools over a long list of conveniences, since each one is both a potential slowdown and a potential data-handling question.
Realistic timelines for healthcare site performance
Quick technical wins, image compression, caching, deferred scripts, usually show measurable improvement within days. The harder question is how long it takes for that speed work to translate into more booked appointments and better search visibility, and the honest answer is six to twelve weeks for most clinics, since search engines need time to recrawl pages and patients need time to notice a faster experience.
Iterative monitoring beats a single large overhaul in most cases we’ve seen. A clinic that fixes one bottleneck, measures it, then moves to the next tends to end up with a more stable site than one that attempts a full rebuild in one pass. Beyond Core Web Vitals, we track booking conversion rate and whether forms are capturing patient information cleanly without adding unnecessary friction or risk.
— Felix
How AdJet Marketing can help
Speed work only pays off when it’s connected to more booked appointments, and that connection is where we focus. We treat performance fixes as part of a larger conversion picture: a faster page that still has a confusing booking flow won’t move the needle on its own, so we pair technical fixes with the landing page and form work that turns traffic into scheduled visits.
For clinics that want this handled without pulling staff away from patient care, our services map directly onto what this article covers:
- Search engine optimization work that includes technical performance fixes alongside the content and structure changes that support rankings.
- Web design built on a lighter foundation from the start, rather than retrofitted onto a bloated template.
- Conversion rate optimization that ties speed improvements directly to booking and call outcomes.
If you’d rather have a second set of eyes confirm what’s actually slowing your site down and what it would take to fix it properly, our landing page design team can walk through the specifics with you.
FAQ
What is the best online health website?
This question depends on what you’re looking for, directory, provider information, or general health content, and no single site serves every need. For performance benchmarking, comparing your own clinic’s Core Web Vitals against general web.dev targets is more useful than comparing against any one competitor site.
How long does it take for SEO to kick in?
Most sites see measurable ranking movement within six to twelve weeks of meaningful technical and content changes, though this varies by competition and how recently search engines have crawled the updated pages. Speed fixes specifically tend to show up in Search Console’s field data within a few weeks once enough real-user visits accumulate.
What are examples of website features?
For a clinic site, the features that matter most for both speed and conversion include a fast-loading booking or scheduling widget, compressed and properly sized images, a clear click-to-call button that responds instantly, and forms that submit without lag or layout shift. Features that load slowly or shift the page around tend to undermine the very actions they’re meant to support.